Modelling, Simulation and Testing of automotive perception sensors
Sim4CAMSens is a CCAV funded project working on methods to quantify and simulate camera, radar and lidar sensor performance under all conditions.

Evaluating the impact of temperature and ice accumulation for lidar
Following on from last weeks post on Evaluating the impact of temperature and ice accumulation for radar, we will now focus on the results for the lidar sensors.
LiDAR is a crucial sensor for autonomous vehicles, providing detailed environmental mapping through point clouds. To develop a robust LiDAR model capable of simulating the sensors performance in winter conditions, real-world testing has been carried out. These tests collect LiDAR data from specific targets under winter conditions to help us understand how the sensor behaves in environments with snow, ice, and freezing temperatures. Testing has taken place in a cold environmental chamber as well as at a test site in Scotland (figure 1). For the test site in Scotland the primary interest is to quantify the effect of weather in the atmosphere and to minimise the effect of other noise factors.
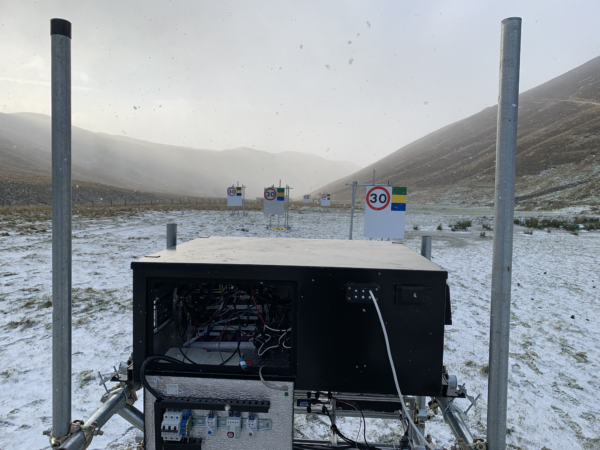
Figure 1: Winter test Site in Scotland (2025)
In cold weather, ice can form on object surfaces, altering their natural characteristics and affecting how they reflect the laser beams. This build-up can weaken the strength of the returned laser signals and reduce the density of the resulting point cloud. To investigate this phenomenon, a controlled test inside a cold chamber was conducted. By analysing how ice influences LiDAR readings, we can determine whether such conditions degrade sensor performance significantly and assess the need for mitigation strategies at the test site in Scotland. One mitigation being considered was whether it was necessary to heat the targets on the test range to prevent frost and ice build-up as the primary purpose of the tests is to quantify the effect of atmospheric conditions on sensor performance.
Test chamber setup
Figure 2 shows the cold chamber used for this experiment, where four key targets were selected to analyse the effect of ice layers on LiDAR sensor readings:
- A sign used at the winter test site manufactured to UK road sign standards
- A radar corner reflector (CR1) with a known Radar Cross Section (RCS)
- Plants
- A glass panel
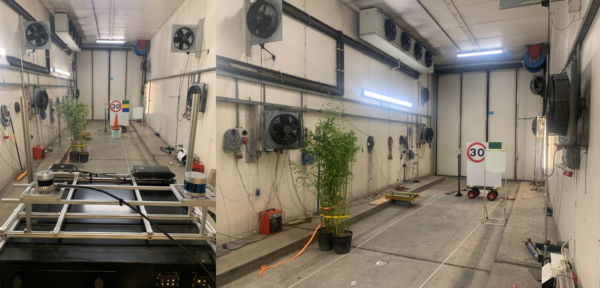
Figure 2: Set up of targets and sensor box in a cold chamber
The temperature was gradually lowered from 20°C to -15°C. To ensure synchronized and consistent data collection, the logging system was configured to record measurements every five minutes. Once cooled down, a precise amount of water was sprayed onto each target and allowed to freeze for 15 minutes. During this time, the sensors continuously recorded data, capturing three sets of measurements at each interval. This procedure was repeated eight times to simulate the progressive accumulation of ice layers on the targets.
Segmenting the Targets in the Point Cloud
Figure 3 presents a frame from the LiDAR data. To isolate each target within the point cloud, a tool was developed to define a cubic boundary around each target as shown Figure 4. These boundaries were manually set and then applied to extract individual targets at each time step as the ice layers gradually accumulated. This segmentation process ensured that the LiDAR data for each target was analysed separately throughout the experiment.

Figure 3: LiDAR point cloud of the cold chamber
Figure 4: Extracted targets from the full point cloud
Results
The performance of the LiDAR sensor was evaluated by analysing changes in both intensity and the number of returned points from the targets.
Intensity Analysis: As shown Figure 5, the intensity of return from the sign and plants gradually decreased with each additional ice layer, stabilizing after the sixth layer. In contrast, the intensity of the glass dropped sharply after the second ice layer but remained nearly constant after the fourth. The reflector exhibited a different behaviour, with its returned intensity increasing as more ice layers were added.
Point Cloud Analysis: Figure 6 illustrates the number of points returned from different targets. The number of points for the plants gradually decreased as more ice layers were added but stabilized after the sixth layer. For the sign, the number of points remained constant; however, the decrease observed at the seventh ice layer was due to the addition of a new object (a cone) in front of the sign. In the case of glass, the number of points dropped after the fourth and fifth ice layers but then remained stable. The reflector maintained a nearly constant number of points throughout the experiment.
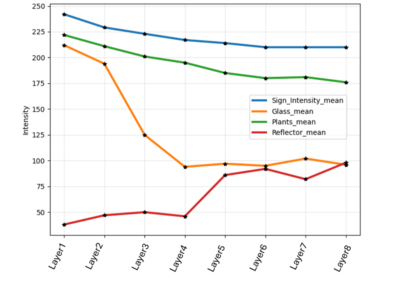
Figure 5: Relationship between the intensity and the number of ice layers
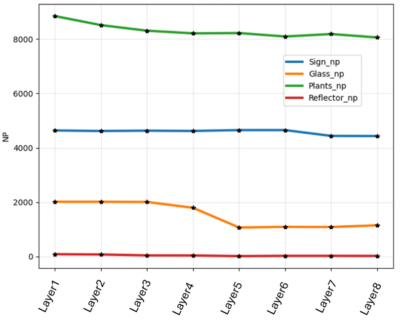
Figure 6: Relationship between the number of points and the number of ice layers
Conclusion
This study highlights the impact of extreme cold on LiDAR sensor performance, particularly in environments where ice accumulation alters target reflectivity. The findings indicate that ice layers can significantly affect the intensity and density of LiDAR returns, with some materials experiencing more substantial signal degradation than others. Notably, while the intensity of most targets decreased with ice build-up, the radar reflector showed an unexpected increase in returned intensity.
The results suggest that while mitigation strategies such as heated surfaces may be necessary for certain materials, they are not required for all targets. The speed limit sign maintained a relatively stable number of returned points, indicating that ice accumulation does not severely impact its detectability. This suggests that heating the signs is not really necessary for the winter test site.
Project Updates
All the latest news, updates and information from our project partners.

Guidelines for the creation of a sensor model simulation handbook
As part of the project, the consortium worked on the validation of sensor models and produced a set of guidelines ...
Sim4CAMSens project final report
The Sim4CAMSens 1 project reached its conclusion in June 2025 and this report attempts to summarise the huge and diverse ...
Roadmaps and Standards Landscape of Perception Sensors and Simulation
This report provides a comprehensive overview of the current and emerging landscape of automotive perception sensors and the standards that ...