Modelling, Simulation and Testing of automotive perception sensors
Sim4CAMSens is a CCAV funded project working on methods to quantify and simulate camera, radar and lidar sensor performance under all conditions.

Evaluating the impact of temperature and ice accumulation for radar
During our first winter testing campaign (January to March 2024), we noticed some uncertainties in the results, which we suspected were caused by ice build up on the targets or freezing temperatures affecting the sensor performance. These factors could alter how the targets reflect signals, so we needed to investigate further. In addition, we wanted to determine whether heating the signs and corner reflectors during our second winter testing (November 2024 to March 2025) was going to be necessary. If frost and ice are found to have minimal impact, we can avoid the need for heating, simplifying future tests and saving time and effort.
In addition to the signs and corner reflectors, we also aimed to investigate the effect of ice and low temperatures on some common road-related targets. To represent these, we included a bamboo tree, chosen for its ability to survive in temperatures as low as -20°C, glass, which is widely used in vehicle windows and a traffic cone, representing a common road obstacle made of plastic. These additional targets allowed us to study a broader range of real-world scenarios and understand how varying materials and structures respond to freezing temperatures and ice accumulation.
To address this, we conducted controlled experiments in a cold chamber, replicating the exact setup from the winter tests with sensor box and 10-meter targets (CR and Lidar target). This allowed us to study the effects of temperature and ice accumulation in a controlled environment, free from the unpredictability of outdoor conditions.
Test method
As shown in Figure 1, CR1, a radar reflector with a known RCS value, and the Lidar Target were positioned 10 meters from the sensor box, aligned directly in front of it. The other targets were arranged at varying distances and angles to represent different real-world scenarios. The Plants, CR2 (another radar reflector), Glass, and Cone were positioned at distances of 4.72 meters, 7 m, 7.43 m, and 8.4 m, and at angles of -7°, -7°, 13°, and 7°, respectively.
The data logging system was configured to ensure synchronized measurements across all sensors at 5-minute intervals. To evaluate the impact of temperature on the targets, the sensors and targets were placed in a cold chamber for 15 hours. The chamber temperature was gradually reduced from 20°C to -15°C, while the data logging system continued recording measurements at regular intervals to capture the impact of the temperature variations on the targets.
After the temperature experiment, the impact of ice layers on target performance was investigated. A controlled amount of water was sprayed onto each target and left to freeze for 15 minutes. During this freezing period, the sensors continued logging data, recording three sets of measurements for each 15-minute interval. This process was repeated eight times to build up the different layers of ice on the targets.
The thickness of the ice was measured after each spraying session. By the end of the experiment, the ice thickness on the CR was approximately 3 mm, while the ice layer on the Plants (specifically on the leaves) was about 1.5 mm.
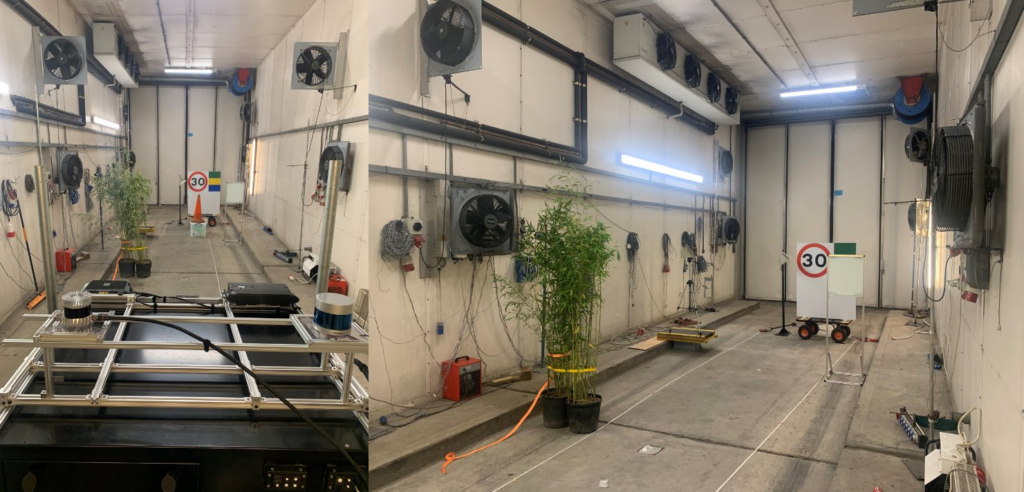
Figure 1: Set up of targets and sensor box in a cold chamber
Radar results
The radar signal loss was measured by comparing the received signal strength from a reference target (a target without ice) to the signal strength when the target was covered by layer of ice. This approach allowed for a direct evaluation of the impact of ice on signal transmission and attenuation. The cold chamber experiments revealed that the target temperature alone did not significantly affect signal loss, indicating that the primary factor influencing attenuation is the presence and thickness of the ice layer rather than the temperature of the target.
The results depicted in Figure 2 demonstrate that as the thickness of the ice layer increased, the signal attenuation also increased. This effect was particularly evident for targets like plants. The organic structure and complex surface geometry of plants caused significant scattering and absorption of the signal, and this effect became more pronounced with thicker ice layers. Similarly, materials like glass and plastic cones exhibited comparable behaviour. Glass, with its smooth surface and higher refractive index, experienced substantial signal loss due to the accumulation of ice. Plastic cones, which typically show moderate reflection and absorption, also exhibited amplified signal attenuation as the ice thickness increased.
In contrast, targets such as the CR and Lidar target reflector showed negligible signal attenuation, even with increasing ice thickness. These findings suggest that for the CR and Lidar target, there is no need to implement heating mechanisms to prevent ice buildup for our second winter testing, simplifying testing logistics and reducing operational complexity.
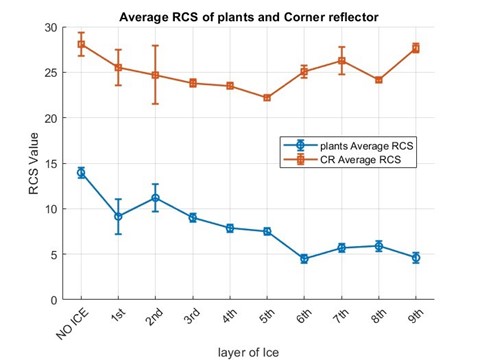
Figure 2: Average RCS of plants and corner reflector with respect to ice layers accumulating target
To calculate the signal loss caused by ice accumulation on various targets, the Fresnel theory [1] can be apply within the simulation model. This model is based on a multilayer structure comprising three distinct layers: air, the ice layer, and the target’s surface material (e.g., cone, corner reflector, plants, or glass). The total transmission coefficient is determined by accounting for the effects of electromagnetic wave transmission at both the air-ice and ice-target interfaces. A key aspect of applying Fresnel theory is incorporating the material properties of the target, particularly its complex permittivity, which governs the interaction of electromagnetic waves with the surface.
In the simulation model developed for AV elevate, the calculated signal attenuation can be apply by adjusting the received power based on the transmission coefficient of the ice layer. This approach ensures realistic modelling of signal degradation caused by ice accumulation.
We will share the results for the Lidar sensors in an upcoming post.
REFERENCES[1] Hayt WH, Buck JA. Engineering electromagnetics. New York: McGraw-Hill; 1981 Jan.
Project Updates
All the latest news, updates and information from our project partners.

Guidelines for the creation of a sensor model simulation handbook
As part of the project, the consortium worked on the validation of sensor models and produced a set of guidelines ...
Sim4CAMSens project final report
The Sim4CAMSens 1 project reached its conclusion in June 2025 and this report attempts to summarise the huge and diverse ...
Roadmaps and Standards Landscape of Perception Sensors and Simulation
This report provides a comprehensive overview of the current and emerging landscape of automotive perception sensors and the standards that ...